2014年9月3日 星期三

更改繪圖axis字型

Example

n = [0:20]; x = [(n-3) == 0];
hd = stem(n,x,'k');
axis([0,20,min(x),max(x)]);
set(get(hd,'Parent'),'FontName','times new roman')


Results

原始圖(字型為Helvetica)

更改後(字型為times new roman)


觀察繪圖區內的屬性

Example:

n = [0:20]; x = [(n-3) == 0];
hd = stem(n,x,'k');
axis([0,20,min(x),max(x)]);
get(get(hd,'Parent'))

Results:
ActivePositionProperty = outerposition
ALim = [0 1]
ALimMode = auto
AmbientLightColor = [1 1 1]
Box = on
CameraPosition = [10 0.5 17.3205]
CameraPositionMode = auto
CameraTarget = [10 0.5 0]
CameraTargetMode = auto
CameraUpVector = [0 1 0]
CameraUpVectorMode = auto
CameraViewAngle = [6.60861]
CameraViewAngleMode = auto
CLim = [0 1]
CLimMode = auto
Color = [1 1 1]
CurrentPoint = [ (2 by 3) double array]
ColorOrder = [ (7 by 3) double array]
DataAspectRatio = [20 1 2]
DataAspectRatioMode = auto
DrawMode = normal
FontAngle = normal
FontName = Helvetica
FontSize = [10]
FontUnits = points
FontWeight = normal
GridLineStyle = :
Layer = bottom
LineStyleOrder = -
LineWidth = [0.5]
MinorGridLineStyle = :
NextPlot = replace
OuterPosition = [ (1 by 4) double array]
PlotBoxAspectRatio = [1 1 1]
PlotBoxAspectRatioMode = auto
Projection = orthographic
Position = [ (1 by 4) double array]
TickLength = [0.01 0.025]
TickDir = in
TickDirMode = auto
TightInset = [ (1 by 4) double array]
Title = [182.015]
Units = normalized
View = [0 90]
XColor = [0 0 0]
XDir = normal
XGrid = off
XLabel = [183.015]
XAxisLocation = bottom
XLim = [0 20]
XLimMode = manual
XMinorGrid = off
XMinorTick = off
XScale = linear
XTick = [ (1 by 11) double array]
XTickLabel = [ (11 by 2) char array]
XTickLabelMode = auto
XTickMode = auto
YColor = [0 0 0]
YDir = normal
YGrid = off
YLabel = [184.015]
YAxisLocation = left
YLim = [0 1]
YLimMode = manual
YMinorGrid = off
YMinorTick = off
YScale = linear
YTick = [ (1 by 11) double array]
YTickLabel = [ (11 by 3) char array]
YTickLabelMode = auto
YTickMode = auto
ZColor = [0 0 0]
ZDir = normal
ZGrid = off
ZLabel = [185.015]
ZLim = [-1 1]
ZLimMode = auto
ZMinorGrid = off
ZMinorTick = off
ZScale = linear
ZTick = [-1 0 1]
ZTickLabel =
ZTickLabelMode = auto
ZTickMode = auto

BeingDeleted = off
ButtonDownFcn =
Children = [ (2 by 1) double array]
Clipping = on
CreateFcn =
DeleteFcn =
BusyAction = queue
HandleVisibility = on
HitTest = on
Interruptible = on
Parent = [1]
Selected = off
SelectionHighlight = on
Tag =
Type = axes
UIContextMenu = []
UserData = []
Visible = on


2014年7月17日 星期四

Legend中的字型與大小也能變更

Example:
>> plot(1:10,[1:10].*cos([1:10]),'-rs',1:10,[1:10].*sin([1:10]),'-.bo',...
1:10,[1:10].*cos([11:20]),'-g*',1:10,[11:20].*sin([11:20]),'-.k+',...
1:10,[1:10].*cos([21:30]),'--c>',1:10,[21:30].*sin([21:30]),'--yd')
>> h = legend('\fontname{標楷體}{隨機選取}\fontname{times new roman}{Lena}',...
'\fontname{標楷體}\fontsize{6}{隨機選取}\fontname{times new roman}\fontsize{10}{F16}',...
'\fontname{標楷體}{隨機選取}\fontname{times new roman}{Pepper}',...
'\fontname{標楷體}{非隨機選取}\fontname{times new roman}{Lena}',...
'\fontname{標楷體}{非隨機選取}\fontname{times new roman}{F16}',...
'\fontname{標楷體}{非隨機選取}\fontname{times new roman}\fontsize{8}{Pepper}');
>> xlabel('\fontname{times new roman}{\itp}')
>> ylabel('\fontname{times new roman}{\itPSNR}')


2013年6月5日 星期三

2013年4月10日 星期三

第六週課程----stem()、stairs()、feather()、compass()、errorbar()、plotyy()


5.火柴棒圖stem()
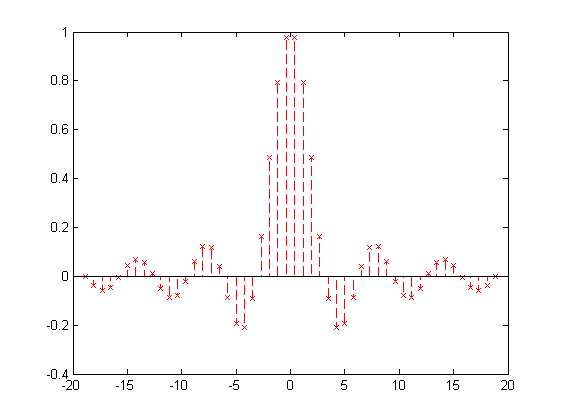
stem()函數命令格式如plot()函數一樣圖示為長短不同的火柴棒,預設的mark為小圓,也可加入線條規範語法(Line specification syntax)來指定繪圖曲線的樣式
例如  
>> x=linspace(-6*pi,6*pi,50);
>> y=sin(x)./(x+eps);
>> stem(x,y,'--rx')


6.階梯圖stairs()
stairs()函數為離散資料的圖式命令格式也如plot()函數一樣圖示為高低不一的階梯可加入線條規範語法(Line specification syntax)來指定繪圖曲線的樣式
例如  
>> x=linspace(-6*pi,6*pi,50);
>> y=sin(x)./(x+eps);
>> stairs(x,y,':k')


7.羽毛圖feather()
feather()函數命令格式雖與plot()函數相似,但主要是沿著曲線路徑繪製出複數的大小與方向的圖示feather()函數可加入線條規範語法(Line specification syntax)來指定繪圖曲線的樣式
例如
>> omg = linspace(-pi,pi,20);
>> z = exp(-i*omg);
>> feather(z,':g')


也可以使用
>> omg = linspace(-pi,pi,20);
>> z = exp(-i*omg);
>> feather(real(z), imag(z),':g')
 

8.誤差條狀圖errorbar()
errorbar()函數的命令格式如下
    errorbar(x,y,e)
其中e為誤差條狀圖長度命令格式也可以是
    errorbar(x,y,L,U)
其中L為下方誤差條狀圖長度、U為上方誤差條狀圖長度errorbar()函數可加入線條規範語法(Line specification syntax)來指定繪圖曲線的樣式

例如
>> omg = linspace(-pi,pi,20);
>> y = sin(omg);
>> e = std(y)*y;
>> errorbar(omg,y,e,'--ro')


9.羅盤圖compass()

compass()函數feather()函數相似,但是以原點輻射出去compass()函數可加入線條規範語法(Line specification syntax)來指定繪圖曲線的樣式
例如
>> omg = linspace(-pi,pi,20);
>> z = exp(-i*omg);
>> compass(z,':c')


          10.雙y軸函數 plotyy()

當大小差異很大的資料要顯示在同一繪圖區時,可以使用雙y軸函數plotyy(),避免過小的數據資料的細節狀況被忽略
plotyy()函數的命令格式如下
    plotyy(x,y1,x,y2,f1,f2)
其中f1與f2為繪圖方法繪圖方法可以使用函數握把(Function handle)(ex: @plot)也能使用字串描述(ex: 'semilogy')plotyy()函數不可使用線條規範語法(Line specification syntax)
例如
>> x = linspace(0,5,100);
>> y1 = cos(5*x)+nthroot(x,3);
>> y2 = exp(x.^2);
>> figure, plot(x,y1,'r',x,y2,'b')

 改用雙y軸函數plotyy()
>> x = linspace(0,5,100);
>> y1 = cos(5*x)+nthroot(x,3);
>> y2 = exp(x.^2);
>> figure, plotyy(x,y1,x,y2,'plot',@semilogy)